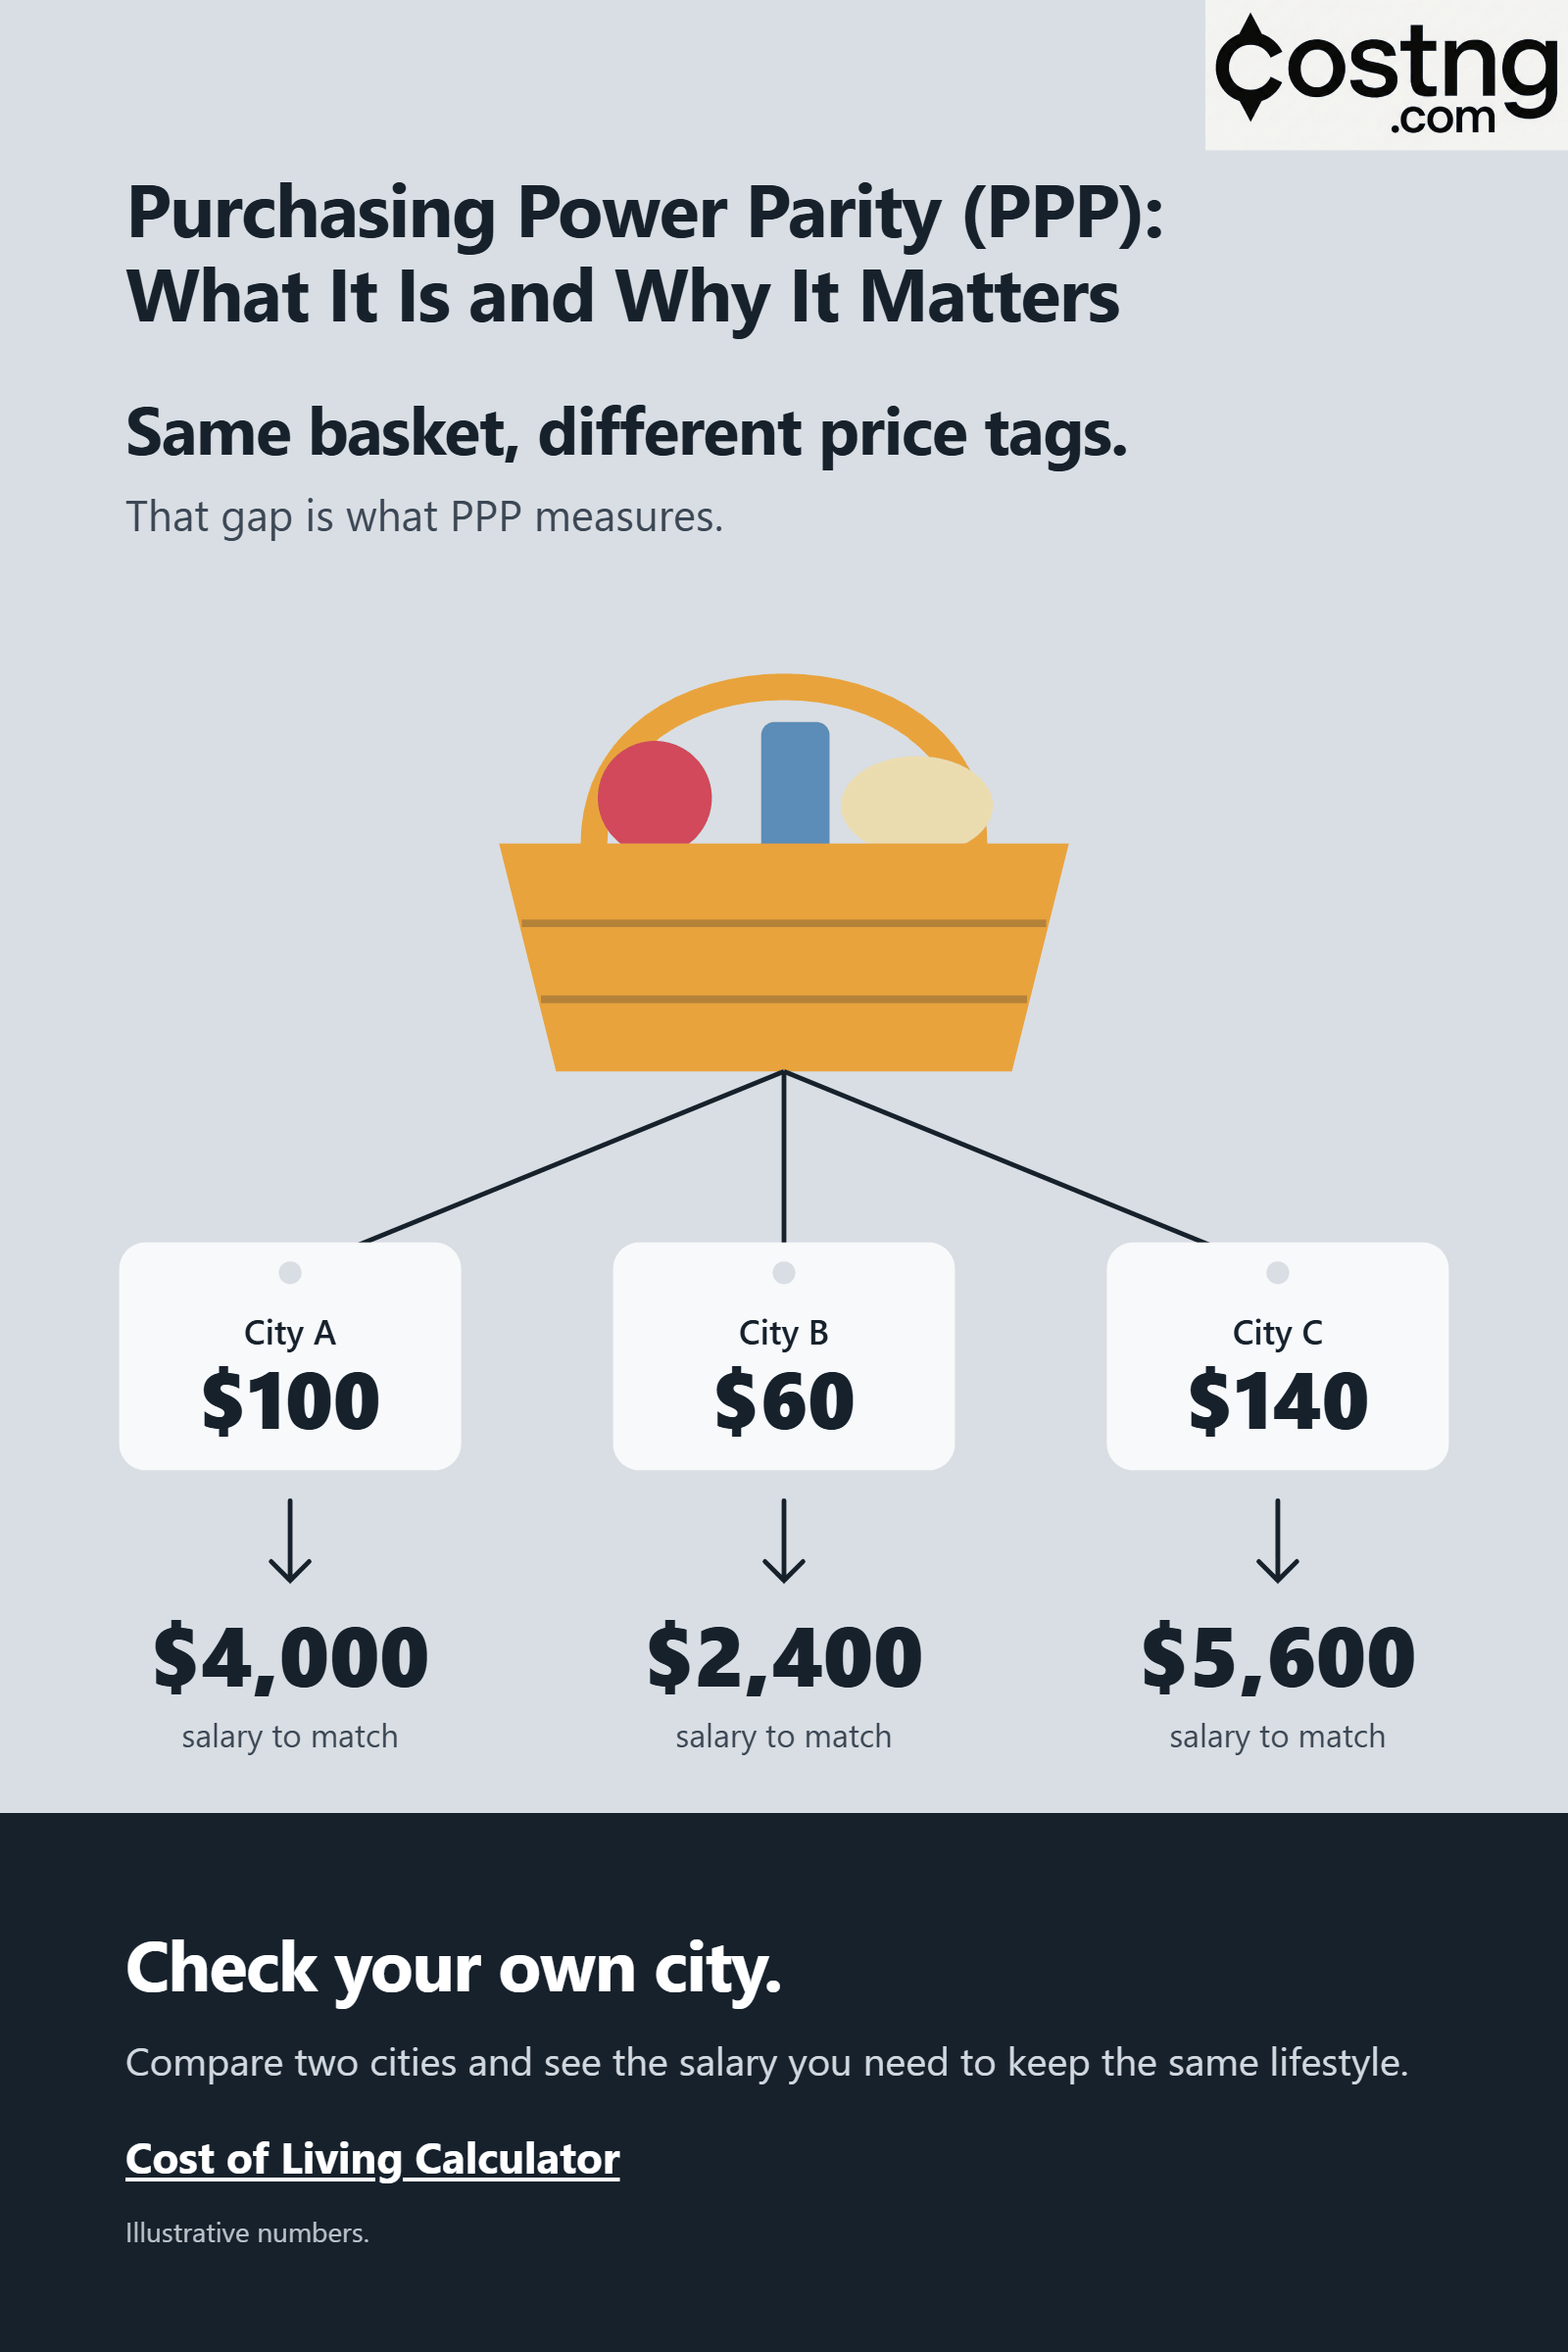
A monthly salary of $4,000 feels very different depending on where you spend it. In one city it might barely cover rent and groceries. In another, it could fund a comfortable life with money left over. Economists have a name for the idea that captures this gap: purchasing power parity, usually shortened to PPP.
PPP asks a simple question: how much does the same basket of goods cost in different places? The answer shapes how we compare national economies, how we measure global poverty, and how individuals decide whether a job offer abroad is actually a raise.
This article explains what PPP is, how it is measured, why it matters, and where it falls short.
The core idea: the law of one price
PPP rests on a principle economists call the law of one price. In a world with no transport costs, no tariffs and perfect competition, an identical good should sell for the same price everywhere once you convert currencies. If a widget cost more in one country than another, traders would buy it where it is cheap and sell it where it is expensive. That activity would push prices together until the gap disappeared.
PPP extends this logic from a single good to a whole basket of goods and services. If the same basket costs 100 dollars in the United States and 8,000 units of another currency elsewhere, then the PPP exchange rate between them is 80 units per dollar. That rate may look nothing like the one you see on a currency board, and the difference between the two is where PPP becomes interesting.
Absolute and relative PPP
Economists distinguish two versions of the theory.
Absolute PPP says that the exchange rate between two currencies should equal the ratio of their price levels. If a basket is twice as expensive in country A as in country B, country A’s currency should buy half as much foreign currency as its domestic prices imply. In practice, absolute PPP almost never holds exactly, but it works as a benchmark.
Relative PPP is more forgiving. It says that changes in exchange rates should reflect differences in inflation between two countries. If one country has 6 percent inflation and its trading partner has 2 percent, the first country’s currency should lose roughly 4 percent of its value over time. This version holds up better over long horizons, especially when inflation differences are large, as in countries that have experienced very high inflation.
How PPP is measured
Measuring PPP is a huge statistical undertaking. Statisticians have to define a basket of goods and services that is comparable across countries, collect prices for each item, and weight everything by how much people actually spend on it. The challenge is that a loaf of bread in one country is not the same product as a loaf in another, and some services, such as healthcare or education, are very hard to compare at all.
The main global effort is the International Comparison Program (ICP), coordinated by the World Bank under the auspices of the United Nations Statistical Commission. The 2021 round was the tenth comparison since the initiative began in 1968, covering 176 participating economies. The results came out on 30 May 2024. Global output measured in PPP terms was $152.4 trillion in 2021.
Regional bodies such as Eurostat and the OECD run their own programs and feed into the global figures. Their work lets us see, for example, that the average price level of the world economy was about 85 percent of the EU average in 2021.
A lighter-hearted measure comes from The Economist, which has published its Big Mac Index since 1986. It compares the price of a Big Mac across countries as a rough, informal test of whether currencies are overvalued or undervalued. It is not rigorous, since a burger is a single product, but it illustrates the idea in a way anyone can grasp.
Why PPP matters
Comparing the size of economies
Converting GDP at market exchange rates can badly understate the real output of countries where prices are low. PPP adjusts for this. The change in perspective can be dramatic. In the 2021 ICP results, China and the United States were the two largest economies, with PPP-based GDP of $28.8 trillion and $23.6 trillion respectively, together accounting for about a third of world GDP. Measured at market exchange rates, the gap in favor of the United States looks much larger.
Measuring global poverty
PPP is also the foundation of how the world tracks extreme poverty. A dollar goes much further in some places than in others, so the World Bank uses PPP-adjusted dollars to set a single poverty line that means roughly the same thing everywhere. In June 2025 the World Bank updated the international poverty line to $3.00 per person per day in 2021 prices, replacing the earlier $2.15 line based on 2017 PPPs. The update raised the estimated number of people in extreme poverty in 2022 by 125 million. The World Bank stressed that revisions of this kind reflect updated price data and national poverty lines rather than a sudden deterioration in living conditions.
Judging currencies
PPP is also used as a long-run anchor for exchange rates. If a currency trades far below its PPP-implied value, analysts may call it undervalued and expect it to strengthen over time. Policymakers, investors and researchers all use this framing, though with caution, for reasons covered below.
Personal decisions
For individuals, PPP translates into a very practical question: what is my money worth if I move? A salary comparison that ignores local prices is close to meaningless. Someone offered a 20 percent pay rise to relocate might find that higher rent, transport and food costs more than cancel it out. Someone taking a pay cut might actually end up better off.
Why PPP does not hold perfectly
If the theory is so appealing, why do real-world exchange rates not simply follow it? Several things get in the way.
Transport costs and trade barriers. Moving goods costs money, and tariffs, quotas and regulations add friction. These keep prices from equalizing, even for goods that can be traded.
Non-tradable goods and services. Haircuts, restaurant meals, rent and local transport cannot be shipped across borders. Their prices are set by local conditions, mainly local wages, so they can differ enormously between countries.
The Balassa-Samuelson effect. This is one of the most important explanations for why price levels differ systematically. Productivity in tradable sectors, such as manufacturing, tends to be much higher in rich countries. Wages in those sectors rise, and because workers can move between sectors, wages in non-tradable services rise too, which pushes up the price of services. The result is that rich countries tend to be more expensive overall, and poor countries cheaper, even when tradable goods cost about the same.
Pricing power and market structure. Companies often charge different prices in different markets depending on competition, taxes and what customers are willing to pay.
Short-run volatility. Exchange rates move on interest rate expectations, capital flows, political news and market sentiment, none of which have much to do with the price of a basket of goods. Over months or even years, currencies can drift far from their PPP values. Evidence suggests that deviations do tend to shrink over long horizons, but slowly.
Criticisms and limits
PPP is useful, but it is not a perfect measure, and its critics raise several fair points.
The first is comparability. Building a basket that represents consumption in a wealthy European capital and a rural village in a low-income country at the same time involves judgment calls. Quality differences are hard to adjust for, and consumption patterns vary.
The second is revision risk. New rounds of price surveys can shift estimates substantially, which can change country rankings and poverty counts. The 2025 poverty line change is a good example of how a new set of PPPs can move headline numbers without anything changing on the ground. The World Bank also notes that ICP results are produced by the program itself, not by national statistical agencies as part of their official statistics.
The third is averages hiding variation. A national PPP rate is an average. Prices in a capital city can differ sharply from those in the rest of the country, and your own spending pattern may look nothing like the national basket. Someone who spends mostly on rent will feel the cost of living very differently from someone who spends mostly on imported electronics.
From national PPP to city-level comparisons
This last point is exactly why city-level tools are useful. National PPP figures are valuable for macroeconomics, but they say little about whether moving from one specific city to another will leave you better or worse off. A comparison between two cities, broken down by category, gets closer to your actual situation.
That is the idea behind the Cost of Living Calculator (sometimes called the “COLA” for short). You choose your current city and a destination city, enter your monthly salary after tax, and the tool shows the equivalent salary you would need in the new city to maintain the same standard of living. It also shows which city is more expensive, by how much, and which cost categories drive the difference. It is a simple way to turn the theory in this article into a number you can use when weighing a job offer, a move abroad, or a remote-work decision.
As with any PPP-style estimate, treat the output as a guide rather than an exact answer. Your own habits, housing choices and tax situation will always matter.
The bottom line
Purchasing power parity is one of the most useful ideas in international economics. It starts from the intuition that money is only worth what it can buy, and it turns that intuition into a framework for comparing economies, measuring poverty and evaluating currencies. It is also imperfect. Trade frictions, non-tradable services, productivity differences and statistical limits all stop it from holding exactly.
Still, the core insight remains powerful, and it applies at every scale, from comparing the world’s largest economies to deciding whether a new job in a new city is really a step up.
Sources
- World Bank, Global PPP data release, 30 May 2024
- World Bank, ICP 2021: Size of economies
- Eurostat, Purchasing power parities in Europe and the world
- World Bank, June 2025 Update to Global Poverty Lines
- World Bank Data Blog, The World Bank’s new global poverty lines in 2021 prices