Introduction
Comparing the cost of living between Lahore and London, or Singapore and São Paulo, isn't as simple as checking exchange rates. A cost of living index by city solves this by converting real-world prices for housing, food, transport, and daily expenses into a single comparable score. This guide explains exactly how that score is built, what it means in practice, and why city-level data has become more useful than country-level averages for anyone relocating, hiring globally, or planning an investment in 2026.
What Is a Cost of Living Index by City?
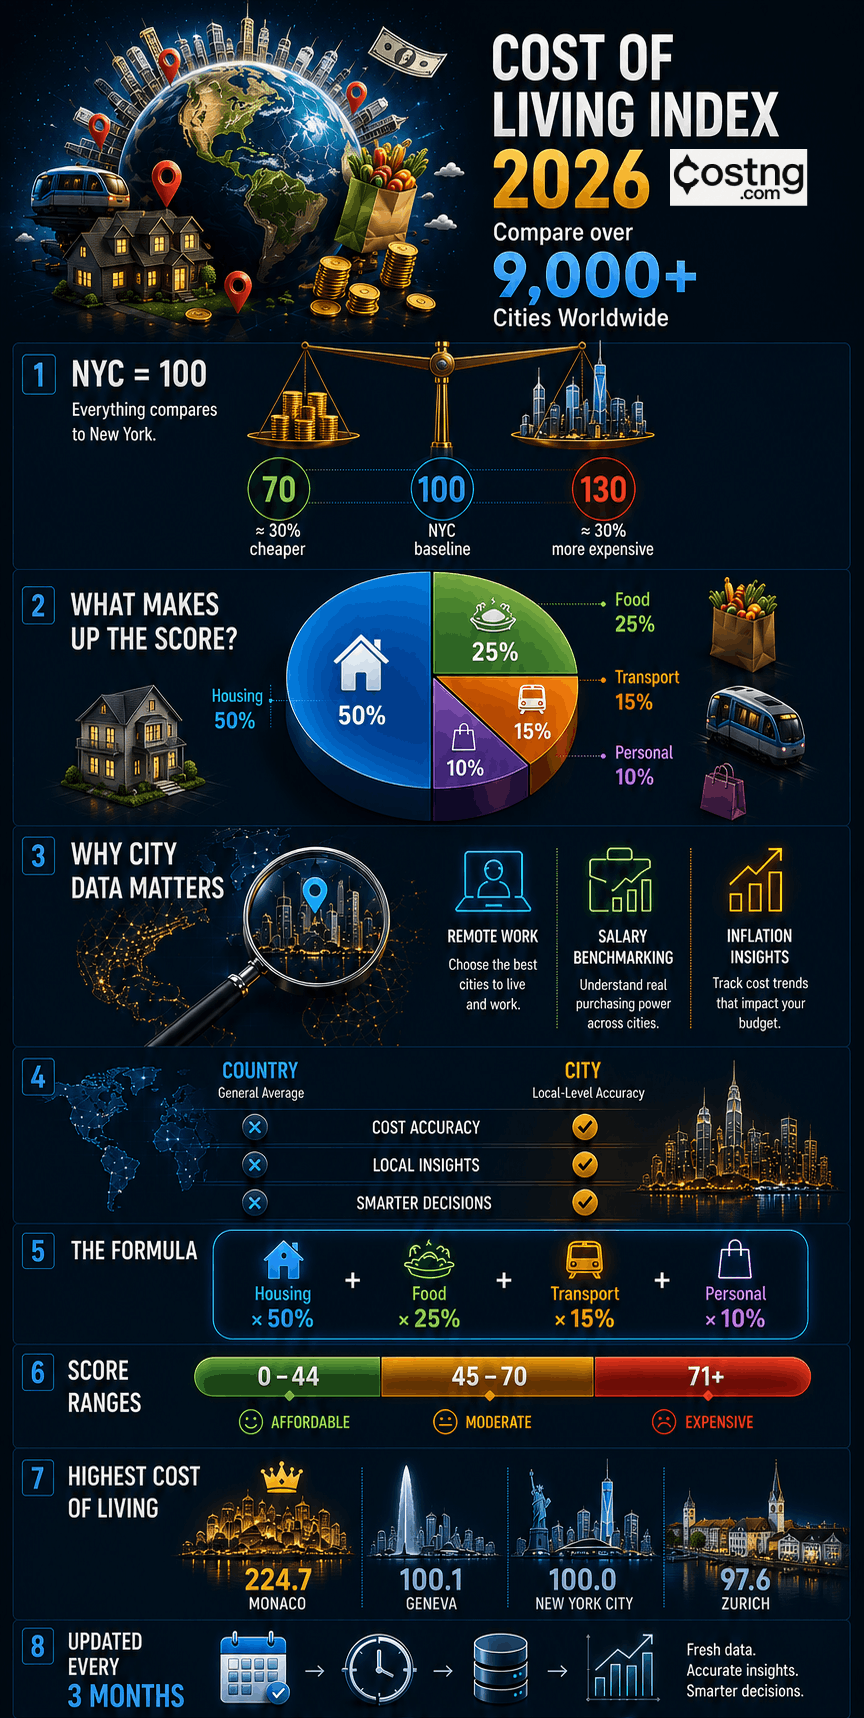
A cost of living index by city is a standardized score that measures how expensive it is to live in a given city relative to a baseline city, almost always New York City, which is set at 100.
If a city scores 70, everyday expenses there are roughly 30% cheaper than in New York. If it scores 130, expenses run about 30% higher. The index doesn't track a single price; it blends housing, food, transportation, and personal expenses into one weighted figure so cities can be compared on equal footing.
Cities within the same country can vary dramatically. A national average might mask the gap between a capital and a smaller regional city, which is why indexing at the city level not the country level produces numbers people can actually act on.
Why City-Level Cost of Living Index Matters in 2026
Three forces have made city-level indexing more relevant than ever:
- Remote work and the digital nomad economy mean people increasingly choose where to live independent of where they work, making city-by-city affordability the deciding factor rather than national averages.
- Corporate relocation and global hiring require HR teams to benchmark salaries against the specific city an employee will live in, not the country as a whole.
- Inflation has become uneven across cities even within the same nation, so a country-level figure from a year ago can be misleading for a specific urban market today.
Cost of Living Index by Country vs. By City
| Aspect | Country-Level Index | City-Level Index |
|---|---|---|
| Precision | Broad national average | Localized, granular pricing |
| Use case | General economic comparison | Relocation, salary benchmarking |
| Accuracy for urban decisions | Often outdated or diluted | Reflects real, current expenses |
| Captures intra-country variation | No | Yes |
Country-Level Index
A country-level index averages prices across an entire nation. It's useful for macroeconomic comparisons but loses accuracy the moment you need to make a decision about a specific city, since it blends expensive capitals with cheaper rural areas.
City-Level Index
A city-level index isolates pricing for one urban area: actual rents, grocery baskets, transit fares, and local services. This makes it the more reliable input for relocation budgets, expat planning, and salary benchmarking.
Why City Cost of Living Data Is Difficult to Build
Building accurate city-level data is harder than it looks, for several reasons:
- Price variability across neighborhoods within the same city can be substantial, with downtown rents differing sharply from suburban ones.
- Currency fluctuations can shift a city's relative ranking even when local prices haven't changed.
- Inflation lag means published data can trail real-world price changes by months if updates aren't frequent.
- Seasonal pricing changes affect categories like travel, energy, and some food items throughout the year.
- Rental market volatility, especially in high-demand cities, can move housing costs faster than other categories.
These challenges are why update frequency and methodology transparency matter as much as the score itself.
Introducing the Cost of Living Index by City 2026
COSTNG.COM's city-level index now covers more than 9,000 cities worldwide, structured as a continuously scaling dataset rather than a fixed annual snapshot. The goal is a research-grade global economic monitoring system that tracks affordability shifts as they happen, with coverage expanding as new cities and data sources are added. Explore the full interactive dataset on the cost of living by city page.
Top 10 Most Expensive Cities in 2026
| Rank | City | Country | Score |
|---|---|---|---|
| 1 | Monaco | Monaco | 224.7 |
| 2 | Monte Carlo | Monaco | 176.0 |
| 3 | Zug | Switzerland | 110.1 |
| 4 | San Mateo | United States | 100.2 |
| 5 | Geneva | Switzerland | 100.1 |
| 6 | New York City | United States | 100.0 |
| 7 | Newport Beach | United States | 99.9 |
| 8 | Cayman Islands | UK Territory | 99.9 |
| 9 | Redwood | United States | 98.3 |
| 10 | Zurich | Switzerland | 97.6 |
How COSTNG.COM Builds Its Cost of Living Index
COSTNG.COM addresses these challenges through an independent data collection process rather than relying solely on third-party aggregation. The methodology includes a proprietary weighting model, multi-source verification to cross-check pricing data, and city-level granularity across more than 9,000 cities worldwide.
At COSTNG.COM, we update all city-level cost of living data every three months to ensure accuracy aligned with real-world economic changes.
This quarterly cycle is designed to reduce the inflation lag and rental volatility issues described above, keeping scores closer to current market conditions than annual or irregularly updated datasets.
How Cost of Living Index Is Calculated
Core Formula Structure
Most cost of living indexes use a weighted average across four core categories:
Weighted Avg = (Housing × 0.50) + (Food × 0.25) + (Transport × 0.15) + (Personal × 0.10)
Housing carries the heaviest weight because it's typically the largest and most variable expense between cities. The remaining weight is distributed across food, transportation, and personal expenses, each calibrated to its typical share of a household budget.
Key Components of the Index Explained
Housing Costs (50%)
Covers rent benchmarks for apartments of varying sizes, utility costs (electricity, water, internet), and property price averages where ownership data is available.
Food Costs (25%)
Combines grocery basket pricing (staples, produce, dairy) with restaurant and dining-out costs to reflect both at-home and eating-out spending patterns.
Transportation (15%)
Includes public transit fares, fuel prices for car owners, and ride-sharing costs, reflecting how residents actually move around a city.
Personal Expenses (10%)
Covers clothing, entertainment, fitness memberships, and general retail goods the discretionary layer of a household budget.
Understanding the Score System
Every score is read relative to New York City's baseline of 100.
| Score Range | Category | Meaning |
|---|---|---|
| Under 45 | 🟢 Affordable | Significantly cheaper than NYC |
| 45–70 | 🟡 Moderate | Noticeably below NYC, livable budget |
| 71+ | 🔴 Expensive | At or above NYC-level costs |
A higher score means a city is more expensive than New York; a lower score means it's cheaper. The scale is relative, not absolute it tells you how a city compares, not an exact dollar figure.
Data Freshness
All values presented in this index are as of June 30, 2026.
Cut-off dates matter because cost of living figures are time-sensitive. A score that's accurate today can drift within months as rents shift, currencies move, and inflation compounds. Static, infrequently updated data becomes unreliable faster than most users expect, which is why every dataset should carry a clear "as of" date rather than being presented as permanently current.
Who Can Use This Index?
- Job seekers evaluating salary offers
- Expats & digital nomads comparing relocation destinations
- HR teams & recruiters benchmarking international salaries
- Investors & businesses assessing market entry costs
- Remote workers maximizing income potential
- Retirees finding affordable retirement spots
- Students planning study-abroad budgets
- Real estate professionals advising on property trends
- Financial planners guiding client relocations
- Freelancers & entrepreneurs scouting cost-effective hubs
- Policymakers analyzing regional affordability
- Travelers budgeting extended stays
- Non-profits setting field staff allowances
Limitations & Disclaimer
This index is intended for informational comparison only and does not constitute financial advice. Data may lag behind rapid inflation shifts or local anomalies not yet reflected in the latest update cycle. The underlying methodology and scoring model are proprietary to COSTNG.COM. Users making major financial or relocation decisions should supplement this data with current local research.
Final Thoughts
City-level cost of living data has become the more practical standard for relocation, hiring, and investment decisions in 2026, as remote work and global mobility make national averages less useful. COSTNG.COM's quarterly-updated, 9,000+ city dataset is built to keep pace with that shift, with continued expansion planned as more cities and data sources are added.
FAQs
What does a cost of living index score actually mean?
It's a relative comparison to New York City's baseline score of 100. A score of 80 means a city is about 20% cheaper than New York; a score of 120 means it's about 20% more expensive.
How often is the cost of living index updated?
COSTNG.COM updates its city-level data every three months (quarterly) to keep pace with inflation, currency shifts, and rental market changes.
Is a country-level or city-level index more accurate for relocation planning?
City-level indexes are more accurate for relocation decisions because they reflect actual local prices rather than a national average that blends expensive and cheap regions together.
What factors are included in the cost of living calculation?
Housing (50%), food (25%), transportation (15%), and personal expenses (10%), combined into a single weighted average.
Which cities are typically the most expensive in 2026?
Cities like New York, Singapore, London, Monaco, and San Francisco consistently rank among the higher-cost cities globally, though rankings shift with currency and inflation changes.
Key Takeaways
A cost of living index by city scores urban affordability relative to New York City (=100), using a weighted formula across housing, food, transportation, and personal expenses. City-level data outperforms country-level averages for real-world decisions like relocation and salary benchmarking. Scores under 45 indicate affordability, 45–70 moderate cost, and 71+ expense at or above New York levels. COSTNG.COM's index spans 9,000+ cities, updated quarterly, with data current as of June 30, 2026.