
2026 Income Tax Rates in the U.S.: Federal Brackets and a State-by-State Guide
Updated October 16, 2026. All figures apply to income earned in 2026, with returns filed in 2027.
Where you live and how much you earn decide how much of every paycheck you actually keep. Two people with identical salaries can walk away with take-home pay that differs by thousands of dollars a year, simply because of the state on their driver’s license. This guide walks through the 2026 federal income tax system first, then every state’s approach, so you can see how income taxes fit into the larger cost-of-living picture.
The short version
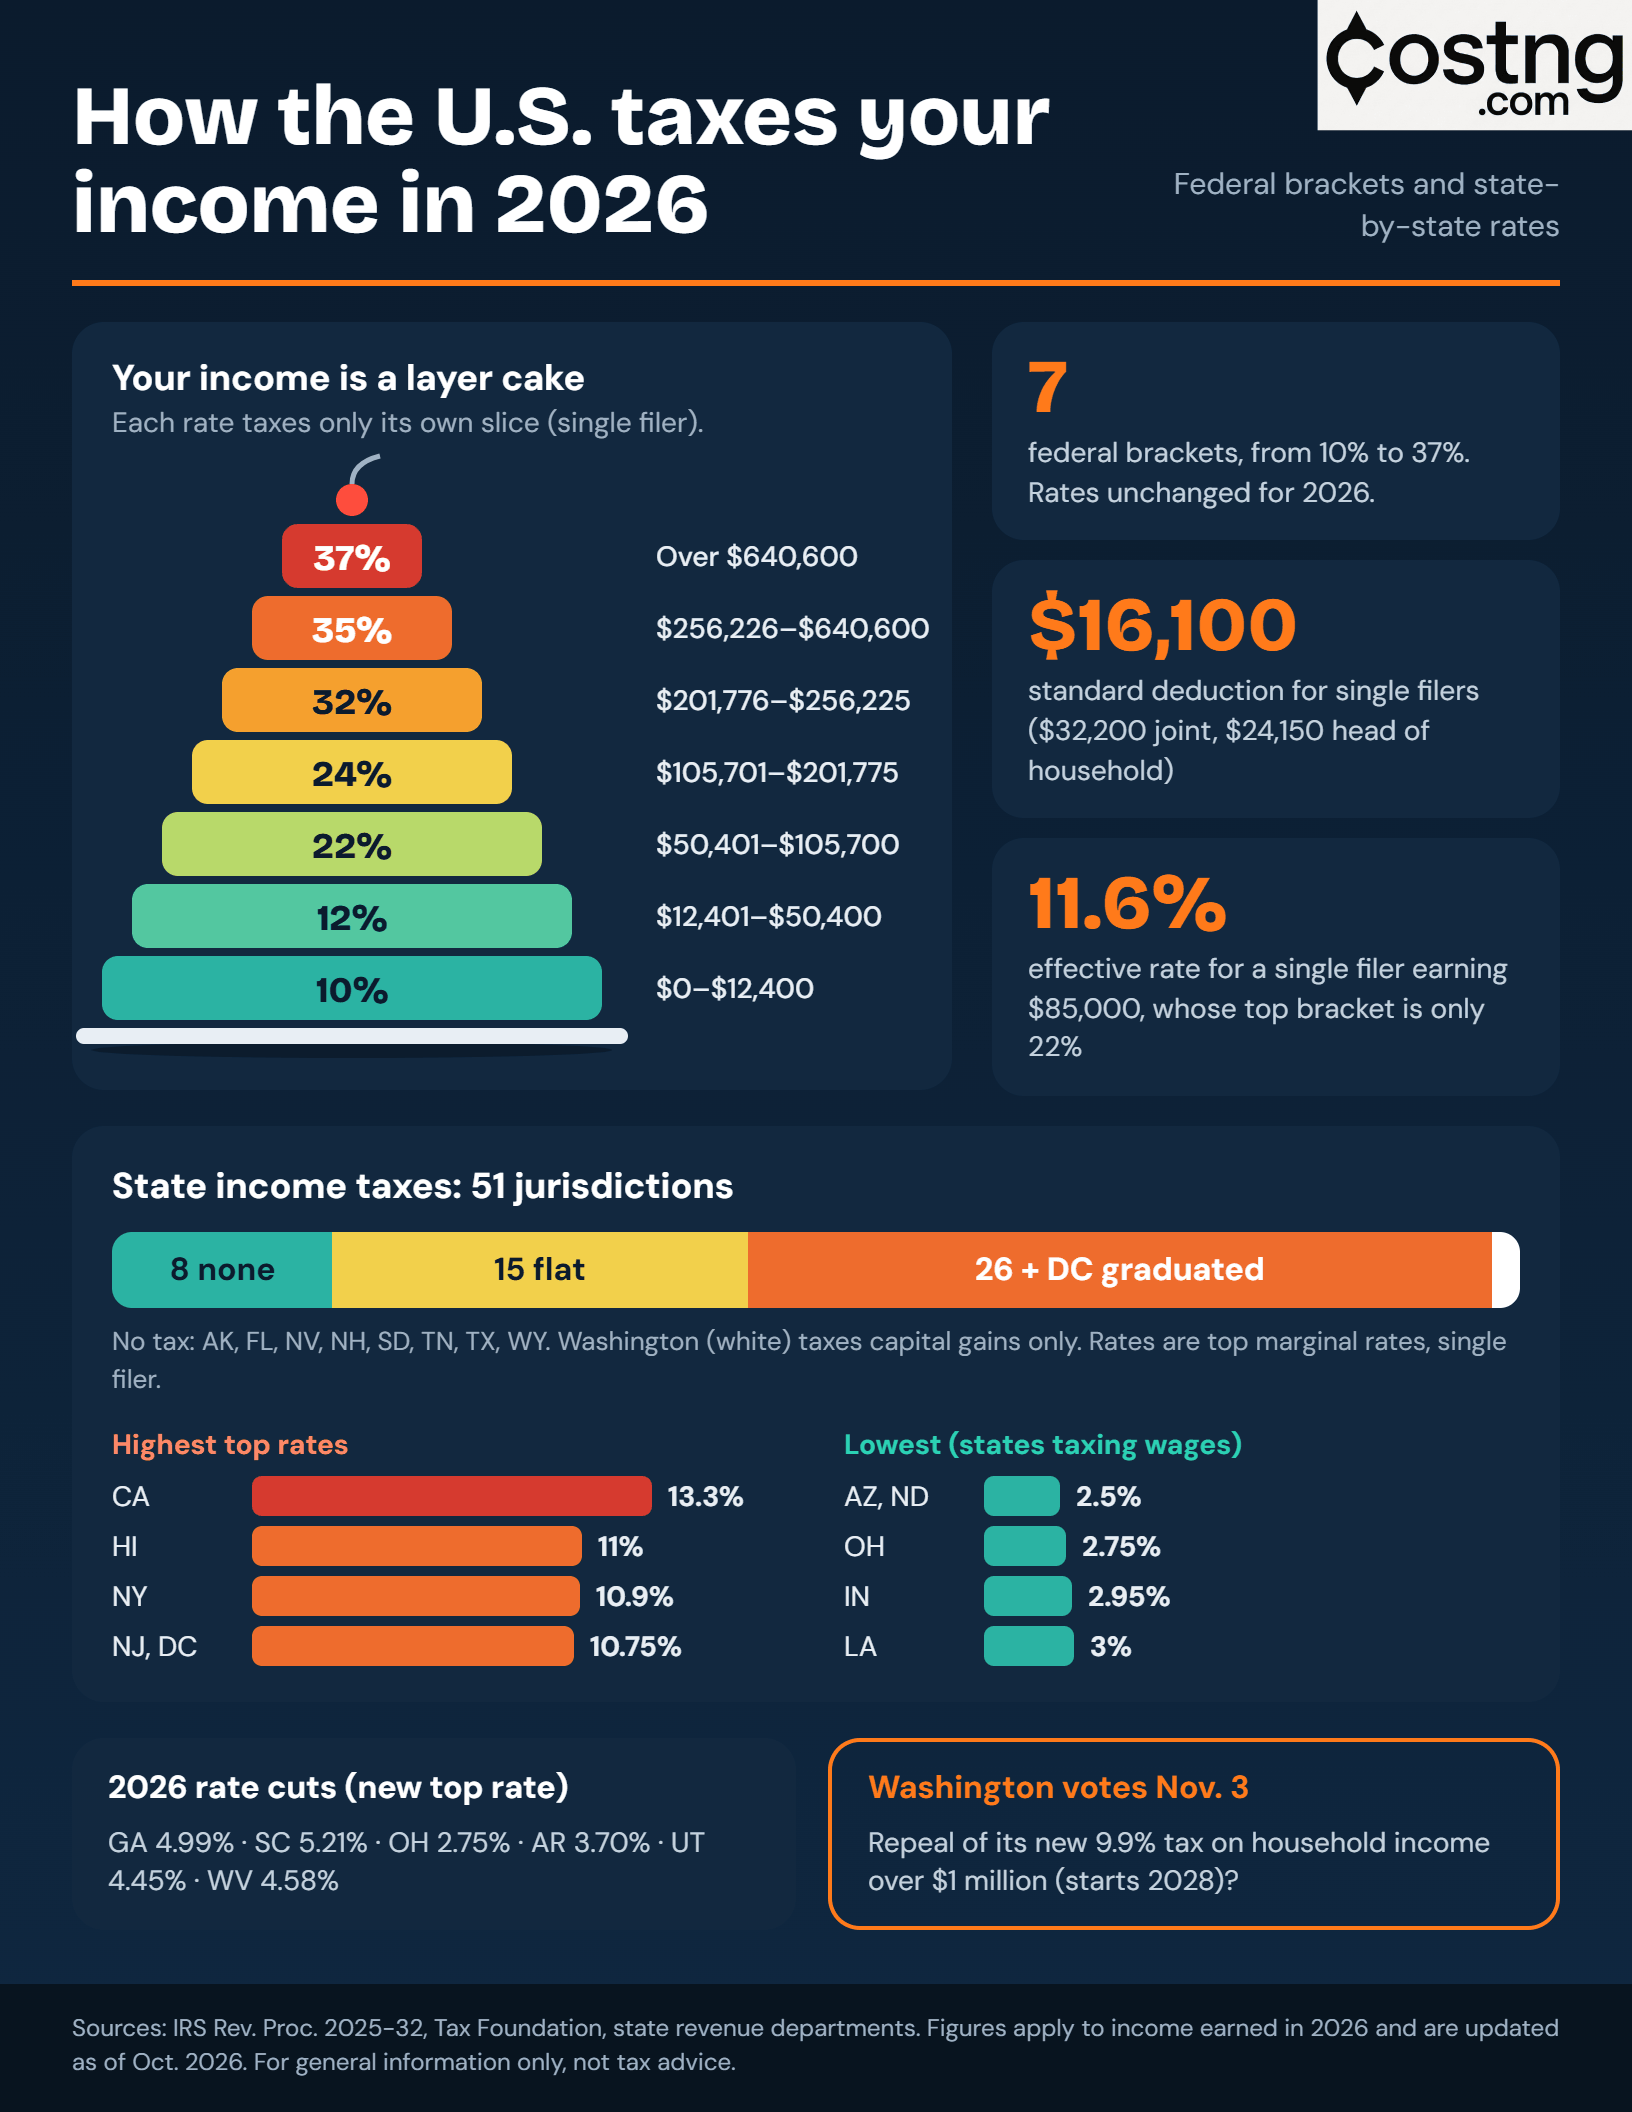
- Federal: There are still seven brackets (10%, 12%, 22%, 24%, 32%, 35% and 37%). The rates did not change for 2026, but the income thresholds were adjusted upward for inflation.
- Standard deduction: $16,100 for single filers, $32,200 for married couples filing jointly, and $24,150 for heads of household.
- States: Eight states levy no income tax at all. Fifteen use a single flat rate. Twenty-six states and the District of Columbia use graduated brackets, and Washington taxes only capital gains.
- Direction of travel: Many states cut their rates again in 2026, and several more cuts are scheduled for 2027. Washington, meanwhile, has a November 3 ballot measure that would repeal a high-earner income tax the state enacted in March.
Part 1: Federal income tax in 2026
The seven brackets
The United States taxes income progressively. That means each rate applies only to the slice of your taxable income that falls inside that bracket, not to everything you earn. The IRS announced the 2026 thresholds in October 2025. The lowest two brackets rose by roughly 4%, while the higher ones rose by about 2.3%.
| Rate | Taxable income |
|---|---|
| 10% | $0 to $12,400 |
| 12% | $12,401 to $50,400 |
| 22% | $50,401 to $105,700 |
| 24% | $105,701 to $201,775 |
| 32% | $201,776 to $256,225 |
| 35% | $256,226 to $640,600 |
| 37% | Over $640,600 |
| Rate | Taxable income |
|---|---|
| 10% | $0 to $24,800 |
| 12% | $24,801 to $100,800 |
| 22% | $100,801 to $211,400 |
| 24% | $211,401 to $403,550 |
| 32% | $403,551 to $512,450 |
| 35% | $512,451 to $768,700 |
| 37% | Over $768,700 |
| Rate | Taxable income |
|---|---|
| 10% | $0 to $17,700 |
| 12% | $17,701 to $67,450 |
| 22% | $67,451 to $105,700 |
| 24% | $105,701 to $201,750 |
| 32% | $201,751 to $256,200 |
| 35% | $256,201 to $640,600 |
| 37% | Over $640,600 |
The standard deduction
Before any bracket applies, most people subtract a standard deduction from their income. The One Big Beautiful Bill Act (OBBBA), signed in July 2025, made the higher deduction permanent and raised the 2025 amounts. For 2026, inflation indexing pushes them up again.
| Filing status | 2025 | 2026 |
|---|---|---|
| Single or married filing separately | $15,750 | $16,100 |
| Married filing jointly | $31,500 | $32,200 |
| Head of household | $23,625 | $24,150 |
Taxpayers who are 65 or older, or blind, get an extra amount on top of this: $2,050 for single filers and $1,650 per qualifying spouse for married filers in 2026. The personal exemption remains permanently set at zero.
How marginal rates work in real life
The most common tax misunderstanding is the idea that a raise can push you into a higher bracket and make your take-home pay shrink. It can’t. Only the dollars above the bracket line are taxed at the higher rate.
Example: a single filer earning $85,000. After the $16,100 standard deduction, taxable income is $68,900.
- The first $12,400 is taxed at 10%: $1,240
- The next $38,000 (up to $50,400) is taxed at 12%: $4,560
- The remaining $18,500 is taxed at 22%: $4,070
Total federal income tax: $9,870. That is about 11.6% of the $85,000 gross salary, even though the filer’s top bracket is 22%. This gap between the marginal rate (the rate on your next dollar) and the effective rate (your average rate) is why the top bracket alone says little about your actual bill.
Example: a married couple earning $150,000 together. After the $32,200 standard deduction, taxable income is $117,800.
- The first $24,800 at 10%: $2,480
- The next $76,000 (up to $100,800) at 12%: $9,120
- The remaining $17,000 at 22%: $3,740
Total federal income tax: $15,340, or about 10.2% of gross income.
These examples assume only the standard deduction and ignore credits, pre-tax retirement contributions and other adjustments, all of which can lower the bill further.
Capital gains and investment income
Profits on assets held longer than a year are taxed at lower rates than wages, using their own thresholds. For 2026, the 0% rate on long-term gains applies to taxable income up to $49,450 for single filers and $98,900 for married couples filing jointly. Above those levels, the rate steps up to 15% and then 20% for the highest earners. Higher-income households may also owe a 3.8% Net Investment Income Tax, which kicks in at $200,000 (single) and $250,000 (joint) and, notably, has never been adjusted for inflation.
Payroll taxes (FICA)
Income tax is not the only federal bite out of a paycheck. Employees pay 6.2% for Social Security on wages up to $184,500 in 2026 (up from $176,100), plus 1.45% for Medicare on all wages with no cap. That is 7.65% for most workers, and employers match it. Earners above $200,000 (single) or $250,000 (joint) also owe an Additional Medicare Tax of 0.9% on the excess. Self-employed workers pay both halves, though they can deduct half of it when computing income tax.
Other 2026 federal changes worth knowing
- Higher SALT cap. The cap on deducting state and local taxes (for people who itemize) rose from $10,000 to $40,400 for 2026. It begins phasing down for households with modified AGI above $505,000 and is scheduled to snap back to $10,000 in 2030 unless Congress acts. For residents of high-tax states who itemize, this is a meaningful change.
- New temporary deductions. OBBBA created deductions for qualified tip income (up to $25,000), qualified overtime pay (up to $12,500 per person) and certain auto loan interest. The tips and overtime deductions begin to phase out at $150,000 of modified AGI ($300,000 for joint filers). The auto loan interest deduction (up to $10,000, for loans on U.S.-assembled vehicles) begins to phase out at $100,000 ($200,000 for joint filers). All three are temporary and are scheduled to end after 2028.
- Enhanced senior deduction. Taxpayers 65 and older can deduct an extra $6,000 each ($12,000 if both spouses qualify) for 2025 through 2028, on top of the regular additional standard deduction for age. It phases out by 6 cents for every dollar of modified AGI above $75,000 ($150,000 for joint filers).
- Child tax credit. The credit is $2,200 per qualifying child.
- Earned Income Tax Credit. The maximum credit is $8,231 for families with three or more qualifying children.
- Retirement limits. You can defer up to $24,500 into a 401(k) in 2026, with an $8,000 catch-up for those 50 and older and a higher $11,250 catch-up for those aged 60 to 63, if their plan allows it. IRA contributions are capped at $7,500.
Part 2: State income taxes in 2026
Federal rules apply everywhere, but state income taxes vary enormously. The numbers below come from the Tax Foundation’s January 2026 snapshot, updated for major changes enacted since then.
Three kinds of states
1. No income tax (8 states): Alaska, Florida, Nevada, New Hampshire, South Dakota, Tennessee, Texas and Wyoming. New Hampshire completed its exit from this club’s fine print in 2025 by repealing its tax on interest and dividends.
2. Flat tax (15 states): Arizona, Colorado, Georgia, Idaho, Illinois, Indiana, Iowa, Kentucky, Louisiana, Michigan, Mississippi, North Carolina, Ohio, Pennsylvania and Utah. Everyone pays the same rate, though deductions and exemptions can still make the effective rate rise with income.
3. Graduated brackets (26 states plus DC): The rest, with anywhere from two brackets (Arkansas, Kansas, Massachusetts, Montana, North Dakota and, as of 2026, South Carolina) to twelve in Hawaii.
Washington sits in a category of its own. It has no tax on wages but taxes capital gains: 7% on gains up to $1 million and 9% above that, after a large deduction.
Every state at a glance
Rates shown are the top marginal rate on wages for a single filer. Where a state has brackets, lower earners pay less than the top rate shown.
| State | Structure | Top rate (2026) |
|---|---|---|
| Alabama | Graduated | 5.00% |
| Alaska | None | 0% |
| Arizona | Flat | 2.50% |
| Arkansas | Graduated | 3.70% |
| California | Graduated | 13.30% |
| Colorado | Flat | 4.40% |
| Connecticut | Graduated | 6.99% |
| Delaware | Graduated | 6.60% |
| District of Columbia | Graduated | 10.75% |
| Florida | None | 0% |
| Georgia | Flat | 4.99% |
| Hawaii | Graduated | 11.00% |
| Idaho | Flat | 5.30% |
| Illinois | Flat | 4.95% |
| Indiana | Flat | 2.95% |
| Iowa | Flat | 3.80% |
| Kansas | Graduated | 5.58% |
| Kentucky | Flat | 3.50% |
| Louisiana | Flat | 3.00% |
| Maine | Graduated | 7.15% |
| Maryland | Graduated | 6.50% |
| Massachusetts | Graduated | 9.00% |
| Michigan | Flat | 4.25% |
| Minnesota | Graduated | 9.85% |
| Mississippi | Flat | 4.00% |
| Missouri | Graduated | 4.70% |
| Montana | Graduated | 5.65% |
| Nebraska | Graduated | 4.55% |
| Nevada | None | 0% |
| New Hampshire | None | 0% |
| New Jersey | Graduated | 10.75% |
| New Mexico | Graduated | 5.90% |
| New York | Graduated | 10.90% |
| North Carolina | Flat | 3.99% |
| North Dakota | Graduated | 2.50% |
| Ohio | Flat | 2.75% |
| Oklahoma | Graduated | 4.50% |
| Oregon | Graduated | 9.90% |
| Pennsylvania | Flat | 3.07% |
| Rhode Island | Graduated | 5.99% |
| South Carolina | Graduated (two rates) | 5.21% |
| South Dakota | None | 0% |
| Tennessee | None | 0% |
| Texas | None | 0% |
| Utah | Flat | 4.45% |
| Vermont | Graduated | 8.75% |
| Virginia | Graduated | 5.75% |
| Washington | Capital gains only | 7% / 9% on gains |
| West Virginia | Graduated | 4.58% |
| Wisconsin | Graduated | 7.65% |
| Wyoming | None | 0% |
Georgia, South Carolina, Arkansas, Utah and West Virginia reflect cuts enacted after the Tax Foundation’s February 2026 snapshot. The other states’ rates are as of that snapshot, so check your state’s revenue department for the latest.
The highest and lowest rates
Highest top rates: California leads at 13.3%, which includes a 1% surcharge on income above $1 million. It also charges a separate payroll tax for disability insurance with no wage ceiling. Hawaii (11%), New York (10.9%), New Jersey and DC (both 10.75%), Oregon (9.9%) and Minnesota (9.85%) follow.
The top rate often tells you less than you might think, because it typically kicks in at very different income levels. New York’s 10.9% applies only above $25 million, and New Jersey’s 10.75% starts at $1 million. California’s 12.3% bracket begins at about $743,000 for single filers. By contrast, Virginia reaches its top rate of 5.75% at just $17,000 of taxable income, and Oregon hits 9.9% at $125,000.
Lowest rates among states that tax wages: Arizona and North Dakota (2.5%), Ohio (2.75%), Indiana (2.95%), Louisiana (3.0%) and Pennsylvania (3.07%). Ohio’s rate applies only to income above $26,050.
What changed in 2026
The past few years have seen an unusually steady wave of state income tax cuts. Since 2021, 26 states have cut their rates. Several of the most notable changes took effect or were passed in 2026:
- Georgia cut its flat rate to 4.99% for 2026, retroactive to January 1, with further annual reductions of 0.125 percentage points planned down to 3.99%, if revenue targets are met. It also raised its standard deduction and created limited exclusions for overtime pay and cash tips.
- South Carolina replaced its three brackets with two rates: 1.99% on taxable income up to $30,000 and 5.21% above it, down from a 6% top rate. It also replaced the federal standard deduction with its own income-adjusted deduction and set automatic future cuts tied to revenue growth.
- Ohio moved to a flat 2.75% on income above $26,050, replacing its old graduated system.
- North Carolina completed its scheduled phase-down to a flat 3.99%.
- Oklahoma collapsed six brackets into three and lowered its top rate from 4.75% to 4.5%.
- Mississippi dropped from 4.4% to 4.0%, Kentucky from 4% to 3.5%, Nebraska from 5.2% to 4.55% at the top, Montana from 5.9% to 5.65%, and Indiana from 3% to 2.95%.
Increases have been rarer. Maryland added two higher brackets (6.25% and 6.5%) and a surcharge on large capital gains. Massachusetts, New York, Washington and DC have also raised their top rates in recent years.
What’s scheduled for 2027
Several cuts are already on the calendar. Indiana’s rate is set to fall to 2.9%, Mississippi’s to 3.75% (heading to 3% by 2030), Montana’s top rate to 5.4% and Nebraska’s to 3.99%. Several other states, including Oklahoma, Indiana, Mississippi and South Carolina, have also built in revenue triggers that could cut rates further, with long-term goals of phasing out the income tax. These triggers depend on tax collections, so none of them are guaranteed.
Washington: a tax in limbo
Washington is the state to watch this fall. In March 2026, the governor signed a law creating a 9.9% tax on household income above $1 million, set to begin in 2028. Opponents gathered more than half a million signatures to put a repeal initiative (I-645) on the ballot, and voters will decide on November 3, 2026, whether to repeal a tax that is already law (the vote is not on whether to create one). A “yes” vote repeals the tax and bars future income taxes; a “no” vote leaves the law in place. The tax also faces separate court challenges over whether it complies with the state constitution. If you are weighing a move to or from Washington, this outcome matters.
Local income taxes
State rates are not the whole story in some places. Roughly ten states allow cities or counties to levy their own income taxes. Based on the Tax Foundation’s estimates of average local burdens, the effect can be material: about 2.4% of income in Maryland, 1.6% in New York, 1.2% in Ohio and roughly 1% in Pennsylvania and Kentucky. These are averages across each state, and a resident of a city with its own tax pays more than the average.
A conformity wrinkle
Most states begin their calculation with a federal number, so federal law changes ripple down. Because OBBBA passed after many legislatures had adjourned, some states that tie themselves to a fixed version of the federal tax code were left with an outdated standard deduction. For 2026 that outdated figure is $8,350 for single filers and $16,700 for joint filers, about half the current federal amount. Arizona, Maine, Maryland and South Carolina were among those flagged at the time (South Carolina has since written its own deduction). States have been updating their rules, so this is worth checking on your state’s tax department website.
Putting it together: the cost-of-living lens
A few points help turn the rate tables into practical decisions:
- Income tax is one piece of the puzzle. States without an income tax still need revenue, and they raise it in other ways, such as sales taxes, property taxes and fees. A state with a 0% income tax rate is not automatically cheaper to live in.
- Your income level matters. A low or moderate earner in a graduated state may pay a lower effective rate than in a flat-tax state, while a high earner often faces the reverse. Looking at the top rate alone can be misleading.
- Your income type matters. Wages, retirement income, Social Security, investment income and business income can all be treated differently by a state. Washington, for example, taxes only capital gains, while Missouri exempts them.
- Federal and state interact. The higher SALT cap means that, for some itemizers, a portion of a high state tax bill is softened at the federal level.
- Rules keep moving. With so many states in the middle of multi-year cut schedules, the numbers you see today may differ next January.
Sources and notes
Federal figures come from IRS Revenue Procedure 2025-32 and the IRS’s 2026 inflation adjustment announcement, cross-checked against published bracket tables. Payroll tax and SALT figures reflect Social Security Administration and IRS limits for 2026 as summarized by tax firms. State figures come from the Tax Foundation’s State Individual Income Tax Rates and Brackets, 2026 (data as of February 2026), updated with reporting and official notices on the 2026 changes: Georgia HB 463, South Carolina H.4216 (South Carolina Department of Revenue and Governor’s office), Arkansas, Utah and West Virginia rate cuts (Tax Foundation), and coverage of Washington’s SB 6346 and Initiative 645 (Ballotpedia, Washington State Standard and Fox 13 Seattle).
This article is for general information and is not tax, legal or financial advice. Tax rules change often, and individual circumstances vary. Consult a qualified tax professional or your state’s department of revenue before making decisions.